Following ongoing increases in the annual rate of growth since March 2013, investor housing credit has fallen in July, does this mark the start of the much vaunted slowdown in investor credit growth?
Following ongoing increases in the annual rate of growth since March 2013, investor housing credit has fallen in July, does this mark the start of the much vaunted slowdown in investor credit growth?
Since the Australian Prudential Regulation Authority (APRA) wrote to Australian authorised deposit-taking institutions last year spelling out sound mortgage lending guidelines, there has been lots of attention on the pace of lending for residential housing investment. The guidelines highlighted a limit on annual investment credit growth for ADIs of 10% however, from that point until June 2015 the annual rate of investment credit growth continued to increase. Although its only one month of data, the latest housing credit data to July 2015 suggests that we may be finally set to see a slowing of investment credit growth.
Over the 12 months to July 2015, the Reserve Bank (RBA) reports that total housing credit rose by 7.4% which was its fastest annual rate of growth since October 2010. This increase consisted of a 5.3% annual increase in owner occupier credit (fastest growth since March 2012) and a 10.8% annual rise in investor credit. Investor housing credit is still growing at a robust pace however, at 10.8% over the year it is down from 11.1% in June and at its lowest level since March 2015. In fact, the monthly investor housing credit data shows credit advanced by just 0.6% in July which was its lowest monthly increase since October 2013.
Annual change in investor housing credit over time
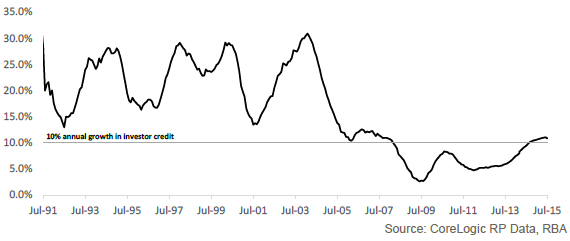
The data on the investment segment of lending would seem to suggest that following recent changes to lending policies by Australian ADIs, lending to the investment segment of the market is set to slow further over the coming months. With mortgage rates remaining low we would anticipate the rate of growth will slow to around the 10% pa benchmark but is unlikely to drop much further than that.
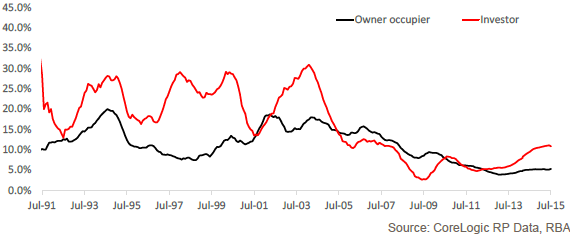
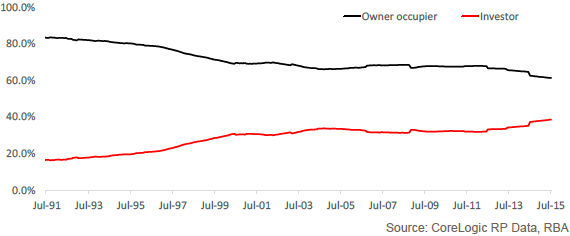
While any slowdown in investment growth may impact on overall housing credit figures, it is important to recall that a much greater proportion of overall lending goes to owner occupiers. In July 2015, the total value of outstanding housing credit was $1.476 trillion. This figure was comprised of $906.4 billion in lending to owner occupiers and $569.8 billion to investors. Again remember that the rate of growth in owner occupier lending has also been rising although over the past year there was $45.2 billion borrowed by owner occupiers compared to $56.1 billion to investors. Furthermore, the proportion of total mortgage credit to investors is at a record high 38.6%.
ADIs, of course, don’t lend exclusively for mortgages and the latest data shows an encouraging lift in credit to businesses. In July 2015 business credit rose by 0.7% to be 4.8% higher over the year. Total business credit is currently recorded at $799.7 billion, which is significantly larger than investment housing credit.
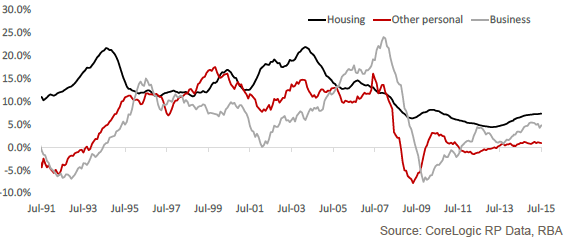
The RBA and APRA would likely be very encouraged to see the first signs of a slowing of lending to the investment housing segment and would hope that it continues over the coming months. While this may result in a bit of a slowing in the increase in overall housing credit growth that shouldn’t be viewed as a negative outcome. If the recent increase in business credit can continue it would arguably provide greater economic benefit.
